
So there’s a local burrito joint near USC, whose primary demographic is the 3 AM student who is less than toxicated. This small shack was one of my favorite places in all of Los Angeles.
It was a normal Thursday night, and I was eating my Loaded Combination Burrito with a three meat blend of chicken, carne asada, and al pastor. It’s always a good night when you’re holding a monster like this in your hand
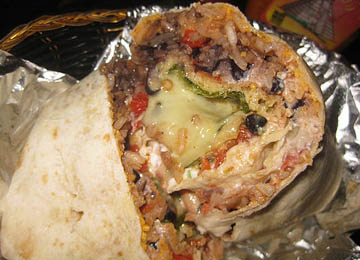
So needless to say my night was going pretty darn well. Until I noticed something extremely brittle crunch against my teeth. It turned out, it was a chicken bone! In my burrito! That was not listed as an ingredient …

So I had two options at this point: I could do the rational thing and stop eating the burrito. Or I could just take my chances. Well, I decided to solve this problem probabilistically.
Let’s define some values:
Let’s say the value I get from choking on a chicken bone in my burrito and dying a gruesome, humiliating death is -100 points.
![]()
And Let’s say the value I get from eating a delicious burrito when I’m hungry is 3 point.
![]()
So, at this point, I decide to take the path with the higher expected value
![]()
If I just stop eating, the expected value of no longer eating is defined as
![]()
Now, in order to find the expected value of continuing eating, I need to also know the probability of finding a bone in my burrito. I believe in my life, I’ve had about exactly 3847 burritos. This is the first time I’ve ever noticed a chicken bone in my burrito. I think it’s also fair to assume that on more than one occasion, I may have simply not noticed the chicken bone in my burrito.
So let’s say
![]()
![]()
Thus
![]()
![]()
And thus, because ![]() I obviously have to keep eating my burrito. The expected dictates such. And satisfied with my statistical analysis, I continue eating my loaded combination burrito without fear of chicken bones. It is a good thursday night again. Until I feel something lodged in the back of my throat: a chicken bone!
I obviously have to keep eating my burrito. The expected dictates such. And satisfied with my statistical analysis, I continue eating my loaded combination burrito without fear of chicken bones. It is a good thursday night again. Until I feel something lodged in the back of my throat: a chicken bone!
As I sat at that plastic table, preparing to pass into the abyss, I couldn’t help but wonder where I went wrong. I thought my analysis was unbreakable. Expected value clearly stated that I must eat the burrito. As I began to see the light, I realized my mistake: I correctly defined
![]() .
.
However, that value was not appropriate for my circumstances. Instead, the value I should have used was ![]() While the probability of a chicken bone showing in a burrito is extremely small, the probability of a second chicken bone showing up given that one has already shown up is much higher. If we recalculate our expected value with this new conditional probability we find
While the probability of a chicken bone showing in a burrito is extremely small, the probability of a second chicken bone showing up given that one has already shown up is much higher. If we recalculate our expected value with this new conditional probability we find
![]()
![]()
Wow. That is a big difference. I guess I should have stopped eating that burrito after all. So moral of the story, if you are eating a burrito and you find a chicken bone, my analysis recommends you stop eating. Also, common sense …

The Bigger Lesson:
Statistical analysis is dangerous. It’s extremely useful and can often provide extremely valuable insights in the decision making process, but its results can potentially be extremely misleading.
For example in this case: the choice of value for ![]() and
and ![]() are rather arbitrary. In this toy example, this is by intent: however, these value statement and semi-arbitrary assignment can have drastic effects. Especially when the uncertainty surrounding these choices are disregarded in later analyses.
are rather arbitrary. In this toy example, this is by intent: however, these value statement and semi-arbitrary assignment can have drastic effects. Especially when the uncertainty surrounding these choices are disregarded in later analyses.
However, the most misleading aspect of this analysis is the reliance of Expected Value as the deciding metric. I present the options as a simple ranking function: whichever action has the greater average outcome is the path you should take. However, ![]() has wildly different connotations than
has wildly different connotations than ![]() , as a result of their variance.
, as a result of their variance. ![]() has zero variance, i.e. if you don’t eat, you are guaranteed zero value: never more, never less.
has zero variance, i.e. if you don’t eat, you are guaranteed zero value: never more, never less.
However, ![]() , even if it were greater than
, even if it were greater than ![]() also contains a much greater variance. This variance is a reasonable proxy for risk, and your personal level of risk aversion could have an impact on your decision beyond the realm of expected value.
also contains a much greater variance. This variance is a reasonable proxy for risk, and your personal level of risk aversion could have an impact on your decision beyond the realm of expected value.

Stepping Away From Burritos:
Say you are the manager of a Taco Bell, and have an offer to begin ordering lettuce in much greater bulk for a month at a time. Say the expected lettuce consumption of your store is 3 tons a month. You decide to order in bulk three tons per month. The statisticians crunch the numbers and find that in the average case, buying in bulk saves money. And since the worst case of this purchase is that you are simply out a few hundred dollars, risk analysis adds very little value.
And so your local Taco Bell statistician get lazy, and decide to just give you final numbers. So one day, you begin considering about opening up a second store. You go to your statistician, ask him to crunch the numbers, and he finds that you can expect to make 1.7x your current profits with two stores. However, what he doesn’t tell you is that this increase in revenue at the second store includes a 30% probability of going out of business and a 70% probability of earning 2.4x your current revenue.
Choosing between a course of action that provides guaranteed 1.7x increase in profits and doing nothing is a no-brainer. Choosing between a course of action that offers a 70% chance of 2.4x increase in profits and 30% chance of going out of business and doing nothing is much more difficult.
The moral of this Burrito-Driven story isn’t that data driven decisions are bad or that you should just wing it and make all your decisions with your gut (please, God no). Rather, my point is that when making a data driven decision, it is extremely important to understand the context in which numbers live, what the decision maker most values ( risk averse, steady growth etc. ), and the assumptions your analysis has made. Otherwise, you may wind up choking on a chicken bone 😉